Alternative hypothesis - There IS a relationship between a person's oral and axilla temperature.
Criteria to REJECT or Failure to reject the Null Hypothesis
- A statistical test uses the data obtained from a sample to make a decision to reject of fail to reject the Null Hypothesis
- Numerical value obtained from the statistical test - test value
- Alpha(α) refers to significance level - in the critical region
We have selected α at 0.05.
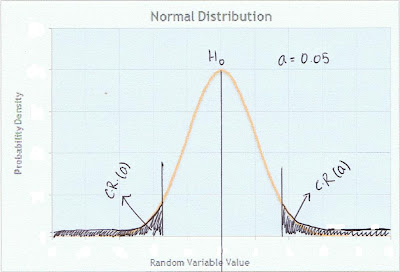
- To reject the Null Hypothesis - the range of values of the test value MUST be in the critical region which indicate there is a significant difference
- Failure to reject the Null Hypothesis - the range of value of the test value MUST be in the non-critical region which indicate that the difference was probably due to chance
- if p value ≥ α, reject the null hypothesis.
- if p value < α, the null hypothesis should not be rejected.
The statistical test depends on the type of research question
- difference
- correlation
.JPG)
As our study is looking for a correlation between oral temperature and axilla temperature and both the variables are scale, we use Pearson's r to do the testing.
 The table we created using SPSS for our results. (Data view)
 (Please click to enlarge)
 (Please click pic to enlarge)
From the data above, we generated a scatter plot for oral temperature vs. axilla temperature using SPSS.
 We also generated Pearson's R coefficient using SPSS.
 The table shows Pearson's coefficient of .919.
The association is r=919 p=0.000, N=30.
Since it exceeds 0.8, it indicate that there are VERY STRONG, SIGNIFICANT and POSITIVE associations between a person's oral & axilla temperatures.
Linear Regression
Knowing that a relationship between a person's oral and axilla temperature exists, linear regression quantifies the relationship by having an equation predicting the person's oral and axilla temperature.


 Oral temperature=1.051*(axilla temperature)-1.337
Re-state final statement:
Thus, we accept the alternative hypothesis that there is a positive and significant between a person's oral and axilla temperature.
No comments:
Post a Comment