Thursday, July 8, 2010

Introduction

Welcome to our blog. This is our HS2135 Statistics ICA blog.

(Just so our dear readers won't hard a hard time scrolling up from the bottom to follow our progress, we have edited our blog entry dates so that you can scroll down to read our entries in natural sequence - from top to bottom!)


Our group memebers are (front left) Alvin, Ismail, Esther, Corina and Baodi.

For this project, our group Research question is

Is a person oral temperature related to his/her axilla temperature?


Some useful facts:
  • Body temperature is measure of the body's ability to generate and get rid of heat.
  • The difference between oral and axillary temperatures is between 0.3 to 0.6° C.
  • Electronic thermometers are most commonly used and recommended.
  • The temperature is displayed on a digital readout. Follow the directions that come with the thermometer. Electronic probe thermometers can be placed in the mouth, rectum, or armpit.
  • The most accurate method for measuring the body temperature is by taking the rectal temperature. Though it is possible in babies and very young children, it might be uncomfortable in older children and adults. And also for nurses who have to take patients' temperature frequently.
  • Taking an oral temperature is always more accurate than taking an axillary temperature. Since the thermometer is outside the reading obtained from an axillary temperature, it will be less than that of the oral or real body temperature.
  • The axillary temperature, though, can be easy to measure as compared to an oral reading, especially in the case of little children.
  • Menstrual Cycle- when woman is ovulating her body temperature is higher than when she is not ovulating
  • Time of the day- body temperature normally flatuates over the day, with the lowest levels at 4am and the highest at 6pm. That why a normal body temperature of 37.5 degree celsius is considered a fever in morning but just normal body temprature in the afternoon

Locations body temperature can be measure:

  • Oral: in the mouth, under tongue
  • Rectal: in the anus
  • Axilla: under the armpit
  • Skin: on the forehead
  • Tympanic: from eardrum to ear canal (infrared)

Defining the Variables:

  • Variable 1: Oral temperature(Scale)
  • Variable 2: Axillary temperature(Scale)


Conceptualization:

  • Oral temperature: temperature taken under the tongue of subject
  • Axilla temperature: temperature taken under the armpit of subject

Literature Review

Tuesday, June 22, 2010

Methodology

Operationalization
  1. To test the accuracy of the thermometer reading, we placed 3 electronic digital thermometers of the SAME brands into the warm water at the SAME time. Result: 2 of the thermometers reported the exact reading of 38.0 but the 3rd thermometers showed a temperature 38.1. We chose the 2 thermometers that reported the same reading.


  2. To maintain consistency and hygiene, thermosheaths were used when we take both oral and axilla route.


  3. Our data collection, we gathered 30 healthy males and females age ranging from 17 years old to 25years old. Below are some of the pictures we took of the participant.


Inaccurate temperature readings can caused by:
  • Taking the temperature within 1 hour after eating ,exercising or smoking.
  • Taking oral temperature within 20 minutes after drinking warm or cold water
  • A weak and dead thermometer's battery
  • Removing the thermometer before the 'beep' sound
  • Not keeping mouth closed around thermometer when measuring oral temperature
  • Not putting the thermometer in the right place (Example: when taking oral temperature,the thermometer's tip should be under the tongue)

The things we do to prevent/ minimise inaccurate readings:

  • Ask the subject when is the last time he/she eat or drink
  • Ensure we heard the 'beep' sound before removing the thermometer
  • Not questioning the subject and reminding them not to talk when they are taking oral temperature
  • Instruct the subject to put the thermometer at the right place
  • Use fresh new batteries for our thermometer

How we are going to approach our subjects:


We will start by introducing ourself that "I am ...... from SHS,Year 2 Nursing student"

  1. Purpose of the study is described by saying "we are doing a research to find out whether there is a relationship between the oral and axilla temperature".
  2. We informed them that we are going to take their oral temperature followed by the axilla temperature and that we will ask for permission to take their picture while taking the temperature.
  3. We thanks the subject for his/her cooperation.

Overview of our Data collection:

The data collection was good, there was some rejection,however, we manage to get our 30 samples.

Statistical Analysis and Results

Null hypothesis - There is NO relationship between a person's oral and axilla temperature.

Alternative hypothesis - There IS a relationship between a person's oral and axilla temperature.

Criteria to REJECT or Failure to reject the Null Hypothesis

  • A statistical test uses the data obtained from a sample to make a decision to reject of fail to reject the Null Hypothesis

  • Numerical value obtained from the statistical test - test value

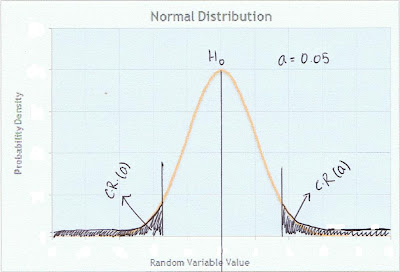
  • Alpha(α) refers to significance level - in the critical region

We have selected α at 0.05.


  1. To reject the Null Hypothesis - the range of values of the test value MUST be in the critical region which indicate there is a significant difference

  2. Failure to reject the Null Hypothesis - the range of value of the test value MUST be in the non-critical region which indicate that the difference was probably due to chance
In another words,
  • if p value ≥ α, reject the null hypothesis.

  • if p value < α, the null hypothesis should not be rejected.

The statistical test depends on the type of research question

  • difference

  • correlation


As our study is looking for a correlation between oral temperature and axilla temperature and both the variables are scale, we use Pearson's r to do the testing.

The table we created using SPSS for our results. (Data view)


(Please click to enlarge)

(Variable View)

(Please click pic to enlarge)

From the data above, we generated a scatter plot for oral temperature vs. axilla temperature using SPSS.


We also generated Pearson's R coefficient using SPSS.


The table shows Pearson's coefficient of .919.

The association is r=919 p=0.000, N=30.
Since it exceeds 0.8, it indicate that there are VERY STRONG, SIGNIFICANT and POSITIVE associations between a person's oral & axilla temperatures.


Linear Regression

Knowing that a relationship between a person's oral and axilla temperature exists, linear regression quantifies the relationship by having an equation predicting the person's oral and axilla temperature.


Oral temperature=1.051*(axilla temperature)-1.337


Re-state final statement:

Thus, we accept the alternative hypothesis that there is a positive and significant between a person's oral and axilla temperature.

Conclusion

Reflection

Esther

Of all the presentation that we have done, I think this one is the most creative way we can present our findings. Through this project, I now have a clearer idea how to conduct a research study and use appropriate statistical tools to present the findings. Although statistics is not one of my favourite subjects, I really appreciate and would like to thank Ms. Chia for her clear explanations and interesting lecture.

Alvin

Designing a blog is an interesting and fun way of presenting our ICA for statistics. I personally enjoys the process we go about collecting data from our fellow schoolmates.As this is the ICA we need to collect our own data we need to plan how we are going to carry it out and what can affect our findings. Hence, we can collect data that is minimal in inaccuracy. Overall, i enjoy the project very much!!!

Corina

To me, of all ICA projects that our group had done,I find this statistic project is rather fun and interesting, and really enjoyed the process; Planning , collecting data , using SPSS , doing blog and more. Doing statistics project and having our project presenting in blog form,I think that is a kind of challenge. However, my group had never thought of giving up. I really appreciate my group for the hard work.

Ismail

To get a headstart for this module was challenging initially and honestly, we were all very confused. However, through the guidance of the lecturers, we were able to comprehend the framework of this project. Throughout the course of doing this project, I had gained a valuable knowledge about the use of statistics that can be intergrated in nursing practice in the coming future. It was indeed a fun and interesting module.

Baodi


As they all have said, we enjoyed doing this project. Blogging as our project was totally new experience to us, so from deciding on research topic to the final designing of the blog layout, careful and active discussions were carried out every time we meet, we really had a lot of fun and gained the ability of team work. Having enjoyed the process of doing this project, I find that statistic is not that boring and it's very useful in our life especially in the career of nursing and that the SPSS is an excellent tool in helping us analysis data. This blog is the evidence of our fantastic experience and effort, hope you will like it, thank you!